UI description
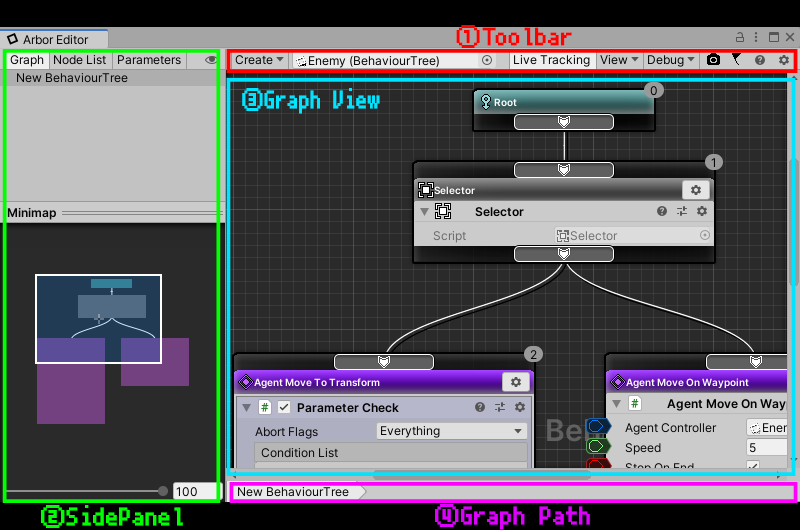
1.Toolbar
“Create” drop down
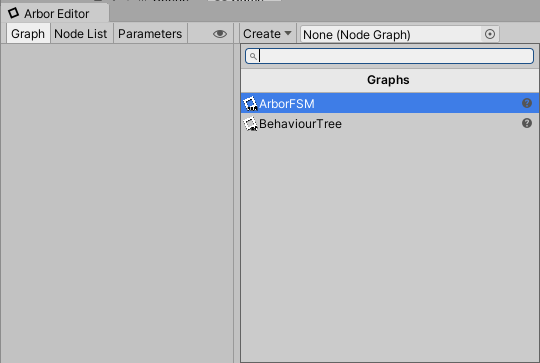
Create a GameObject with the selected graph in the scene.
| Menu | Contents |
|---|---|
| ArborFSM | Create a GameObject with ArborFSM in the scene |
| BehaviourTree | Create a GameObject with BehaviourTree in the scene |
Graph selection field
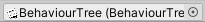
This is a field for selecting a graph.
“Live Tracking” toggle
Toggle active node tracking during play.
“View” drop down
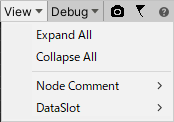
Show menu related to View.
| Menu | Contents |
|---|---|
| Expand All | Expand all collapsed behavior |
| Collapse All | Collapse all deployed behaviors |
| Node Comment | 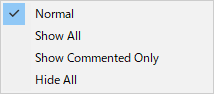
|
| DataSlot | 
|
“Debug” drop down
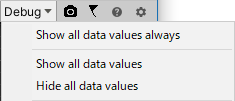
Displays the debug related menu of the graph.
| Menu | Contents |
|---|---|
| Show all data values always | Always display data values regardless of display setting of individual data lines |
| Show all data values | Change to show the output values of all data lines to during play |
| Hide all data values | Change to hide the output values of all data lines |
Refer to the manual of each graph for menu items by graph.
Capture button

Save the entire graph view in the image.
(Maximum size is up to 16384 x 16384)
Notification button

This button will be displayed when a new version is released.
Help button
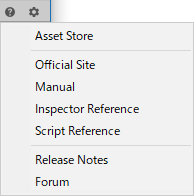
A menu for opening a manual etc. is displayed.
Setting button
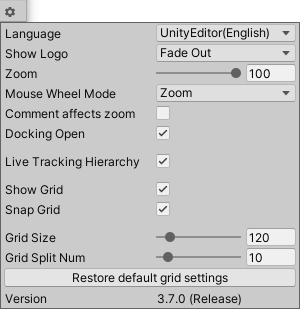
Open the window for setting.
| Item | Contents |
|---|---|
| Language | Select language to display 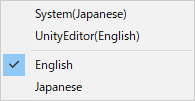
|
| Show Logo | Switch Arbor logo display to graph view 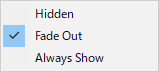
|
| Zoom | Setting amount to zoom out |
| Mouse Wheel Mode | Selection of mouse wheel behavior to zoom or scroll 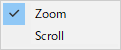
|
| Comment affects zoom | Set whether node comment is affected by zoom |
| Docking Open | Toggle docking when opening ArborEditor window |
| Live Tracking Hierarchy | Switching tracking of graph hierarchy during live tracking |
| Show Grid | Toggle grid display in graph view |
| Snap Grid | Toggle to snap when dragging in graph view |
| Grid Size | Setting the grid width displayed in the graph view |
| Grid Splin Num | Setting the number of split grid sizes |
| Restore default grid settings | Revert the grid setting to default |
| Version | The version of Arbor you are importing |
2.Side Panel
Toggle button on side panel

Switch the display of the side panel.
Graph tab
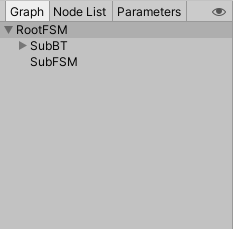
This tab displays the hierarchical tree of the graph.
See Graph Hierarchy for graph hierarchies.
The selected graph is displayed in the graph view.
Rename the graph
There are the following methods to rename.
- Right-click on the graph you want to rename and select Rename.
- Click the selected graph again.
- (Mac) Select the graph and press Enter.
- (Windows) Select the graph and press F2.
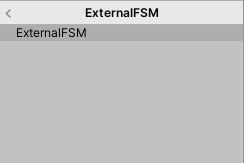
Editing an external graph
If you are using an external graph reference behavior such as SubStateMachineReference, enter the external graph edit mode to edit the graph. is needed.
- Click the > button to the right of the name of the external graph.
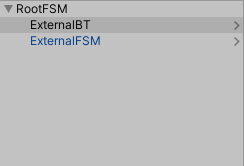
- After editing, click the < button in the header part of the graph tab.
Node List tab
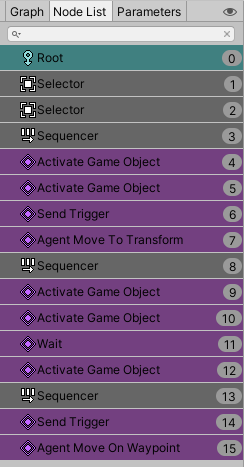
A list of nodes that are placed in the graph.
(Only displayed nodes are nodes involved in graph state)
Method of operation
| Operation | Windows | Mac |
|---|---|---|
| Select | Left mouse button | Mouse button |
| Additional selection / Deselect | Ctrl + Mouse left button | command ⌘ + Mouse button |
| Sequential node selection | Shift + Mouse left button | shift ⇧ + Mouse button |
Parameters Tab
This is a tab about the parameters in the graph.
Create a ParameterContainer
Create a ParameterContainer directly attached to the graph.
- Open the Parameters tab and click the “Create” button.
Edit parameters
You can edit parameters like ParameterContainer.
For details, refer to ParameterContainer.
Minimap
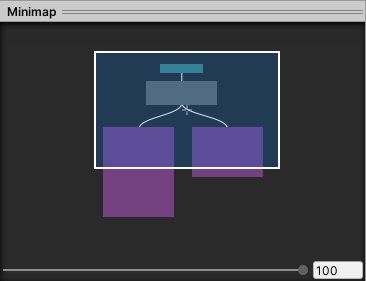
Displays the entire image of the graph currently displayed.
By dragging the rectangle of the display area, you can scroll the display area of the graph view in conjunction with it.
3.Graph View
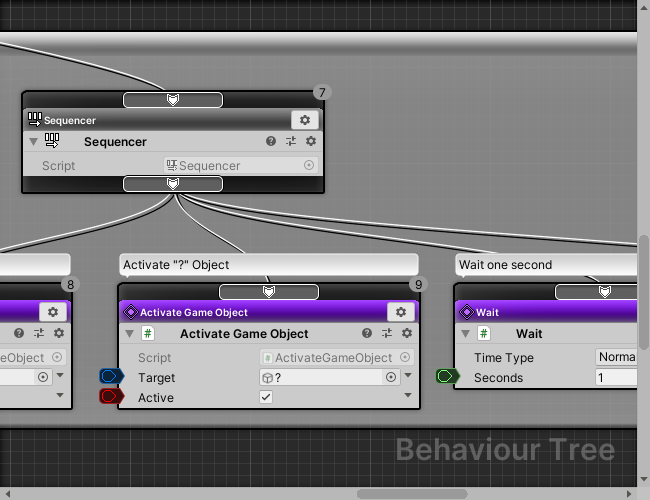
Display node graph.
4.Graph Path

This is the path to the graph currently displayed in the graph view.